
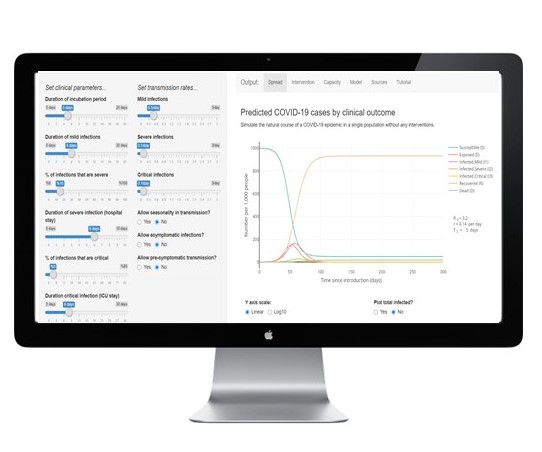
Still looking for an interactive forecasting app for COVID-19? Look no further.
Discover a useful interactive SEIR Modelling app which you can use instantly. This is the same SEIR Model used by WHO to forecast COVID-19 cases and other infectious disease outbreaks.
The SEIR Modelling app is useful if you are doing data-science research projects or helping others during this global pandemic. You can use it to predict COVID-19 outbreak in your region, district or country based on various input parameters.
We have placed an explanation behind the SEIR Model theory at the of this article for your reference. You can access the interactive SEIR Modelling app by clicking on the button below.
Modelling aside, here is a lighter note on forecasting.
Most people say our present is dictated by the past.
Data forecasting has been around for centuries and what has not changed is the underlying principle of forecasting – projecting the future based on past data. What has changed, however, is the introduction of machine learning algorithms that enable prediction to be performed at a much faster speed from larger datasets with higher accuracy.
We have seen how social data can be used to predict macro-economics and consumer behaviour. More about it here.
If there are two things that we can learn from this global pandemic, it would be as follow
- Trusting the data
- Acting on the data
We know every one of us, including the World Health Organization (WHO), is caught by surprise at the exponential growth of reported COVID-19 cases and the number of deaths.
WHO has relied on the outbreak of disease modeling as a robust forecasting technique. Known as the Suspected-Infected-Recovered (SIR), the SIR model has been successfully used in the past to predict disease outbreaks such as Ebola, SARS and now COVID-19.
The new derivative of SIR Model is known as the Suspected-Exposed-Infected-Recovered (SEIR) Model which also adopted by WHO and many other health authorities.
The SEIR differs from the SIR model in the addition of a latency period. The SEIR model incorporates individuals who are exposed (E) – those who have had contact with an infected person, but are not infectious (I).
SEIR Model Explained
To model the progress of infectious diseases in a certain population SEIR models place the individuals into four different compartments relevant to the epidemic. Those are:
- Susceptible (S),
- Exposed (E),
- Infectious (I),
- Recovered (immune by vaccination) (R).
An individual is in the S compartment if he/she is vulnerable (or susceptible) to catching the disease. Those already infected with the disease but not able to transmit it are called exposed. Infected individuals capable of spreading the disease are infectious and so are in the I compartment and those who are immune are in the R compartment.
Since immunity is not hereditary SEIR models assume that everyone is susceptible to the disease by birth. The disease is also assumed to be transmitted to the individual by horizontal incidence, i.e., a susceptible individual becomes infected when in contact with infectious individuals. This contact may be direct (touching or biting) or indirect (air cough or sneeze). The infectious population can either die or recover completely and all those recovered (vaccinated or recovered from infection) are considered immune.
This is a compartmental epidemiological model, based on the classic SEIR model, to describe the spread and clinical progression of COVID-19.
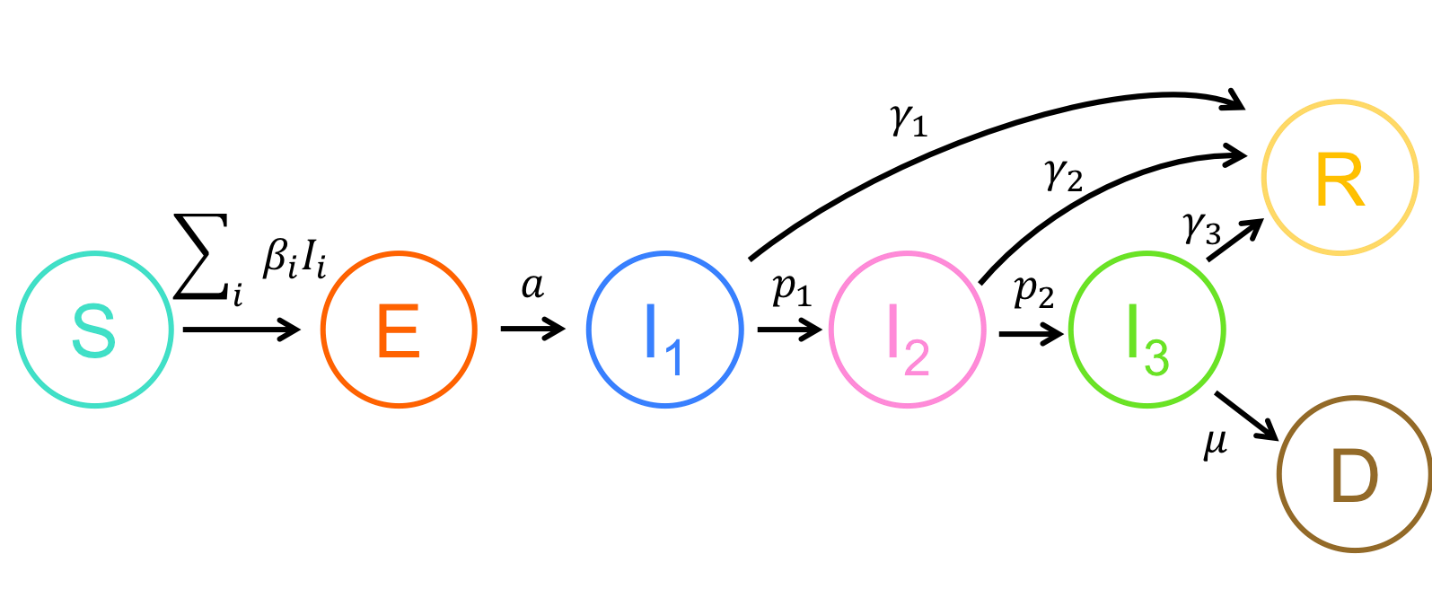
It is important to track the different clinical outcomes of infection, since they require different level of healthcare resources to care for and may be tested and isolated at different rates. Susceptible (S) individuals who become infected start out in an exposed class E, where they are asymptomatic and do not transmit infection.
The rate of progressing from the exposed stage to the infected stage I, where the individual is symptomatic and infectious, occurs at rate a. The clinical descriptions of the different stages of infection are given below. Infected individuals begin with mild infection (I1), from which they either recover, at rate γ1, or progress to severe infection (I2), at rate p1.
Severe infection resolves at rate γ2 or progresses to a critical stage (I3) at rate p2. Individuals with critical infection recover at rate γ3 and die at rate μ. Recovered individuals are tracked by class R and are assumed to be protected from re-infection for life. Individuals may transmit the infection at any stage, though with different rates. The transmission rate in stage ii is described by βi.
Variables
- S: Susceptible individuals
- E: Exposed individuals – infected but not yet infectious or symptomatic
- Ii: Infected individuals in severity class ii. Severity increases with ii and we assume individuals must pass through all previous classes
- I1: Mild infection
- I2: Severe infection
- I3: Critical infection
- R: individuals who have recovered from disease and are now immune
- D: Dead individuals
- N=S+E+I1+I2+I3+R+DN=S+E+I1+I2+I3+R+D Total population size (constant)
Parameters
- βi rate at which infected individuals in class IiIi contact susceptibles and infect them
- a rate of progression from the exposed to infected class
- γi rate at which infected individuals in class IiIi recover from disease and become immune
- pi rate at which infected individuals in class IiIi progress to class Ii+1Ii+1
- μ death rate for individuals in the most severe stage of disease
All rates are per day.
Note: This app was originally developed by Dr. Alison Hill from Harvard University, she has contributed significantly in the area of mathematical and computational tools to better understand, predict, and treat infectious diseases. Please read our disclaimer section for further information.

About the Author
Shahid Shayaa is the founder and managing director of Berkshire Media. He specializes in data-driven communication strategies and insights using social data analytics, social media monitoring tools and machine learning text algorithms for more than 13 years. As an expert in the field of media monitoring, issue management and reputation risks for companies, his deep involvement in various research studies in this field and published various scientific papers on social data analytics, sentiment analysis and back-end algorithms on consumer sentiment, emotions and behaviour for marketers and campaign managers.