
Economics is a branch of social science that goes deeper than understanding the dynamics of supply and demand. In a steady-state, private sectors rely heavily on the Government’s official statistics – which is often time-consuming and heavily dependent on multiple resources to obtain the right numbers.
In light of the global pandemic, what if we can rely on alternative data sources that require significantly fewer resources?
In the absence of official statistics, policymakers rely on analyst’s forecasts – which are predominantly modeling of numbers from financial figures, statistics, and polling surveys.
Growing dependency on economic forecasts brings new waves of opportunity to increase efficiency to plan new policies during a crisis.
Can unstructured data from social media fill this gap and provide new insights to macroeconomics?
Given the potential to improve estimates of economic indicators, Governments and development organizations should consider investing in the acquisition of large unstructured datasets to analyze them
The World Bank,
Malaysia Economic Monitor Report 2017
As we seek for innovation in this new norm, social media presents a new frontier of hope. With social media data recorded exponential growth, this presents an opportunity to turn data into actionable insights for economists, organizations, companies and brand owners.
Here is what we know from the latest research studies.
1. Predicting macroeconomics using social data is cutting-edge
There are two large organizations that have pioneered the idea of using social data in the world of macroeconomics – The World Bank and The European Central Bank.

The World Bank launched a big data program by collecting four million online news articles related to the Malaysian economy in the period from 1996 to 2015.
Measures of economic sentiment known as “News-based Sentiment Index” was derived through an analysis of the proportion of positive words relative to the proportion of negative words appearing in these articles.
And it turned out that this sentiment index proved to be a leading indicator for GDP growth!
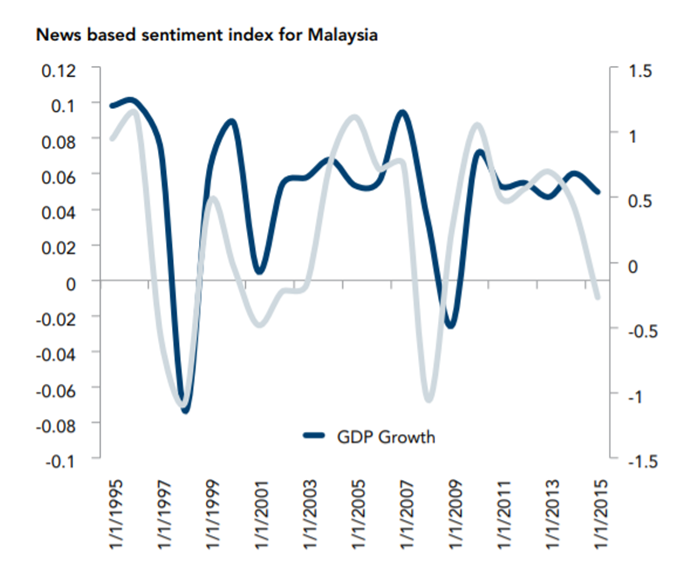
Source: World Bank big data program staff calculations. Note: Fraction of positive minus negative words appearing in a corpus of four million economic new articles from Reuters focusing on Malaysia. The resulting sentiment index is averaged at yearly frequency and tracks fluctuations in yearly GDP growth.
In case you think the World Bank was the pioneer, our research showed that the European Central Bank was the first to publish similar research in 2014. More than three million social media data (over a period of three years) were collected in the Netherlands and the result showed it followed closely the Consumer Confidence Index (CCI) results.
The study revealed a strong association between consumer confidence and public sentiment from social media data.

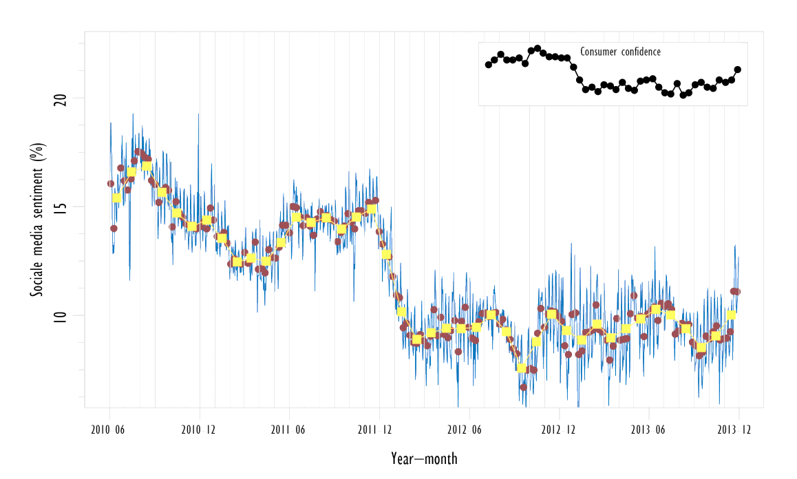
Result of the social media sentiment was compared against the official Consumer Confidence Index (CCI) figures during the same period using Moving Weighted Average (MWA). Source: Social Media Sentiment and Consumer Confidence (Piet J.H Daas and Marco J.H Puts), Statistics Paper Series: No:5/2014, European Central Bank
2. Consumer confidence can be measured using social data
Consumer Confidence Index (CCI) is a macroeconomic indicator to measure how a consumer feels about the economy. The more confident the consumer feels, the more he or she intends to make purchases.

CCI’s data is collected through a set of questionnaires (usually by Gallup polls and other independent poll surveys). However, there are some limitations:
- CCI Survey is performed quarterly, lack of timely information to reach policy-makers, public and private sectors.
- Sample size is limited to 1,200 households per survey, thus making it increasingly difficult to establish a clear landscape.
- Questions may be subjective and subject to wide interpretations.
- Our research team has done extensive work to validate these findings by developing an alternative indicator known as Consumer Sentiment Index (CSI) as early as 2015.
Working alongside a team of scientists and researchers from University Malaya between 2015-2017, more than 2.6 million social media data were extracted across 8 social and digital media channels – across four CCI categories: Purchasing Behaviour, Jobs/Employment, Consumer Price, Personal Finance.
Result based on a 12-month study in Malaysia showed evidence that using an alternative indicator such as CSI can be a potential predictor of the existing Consumer Confidence Index. (CCI)
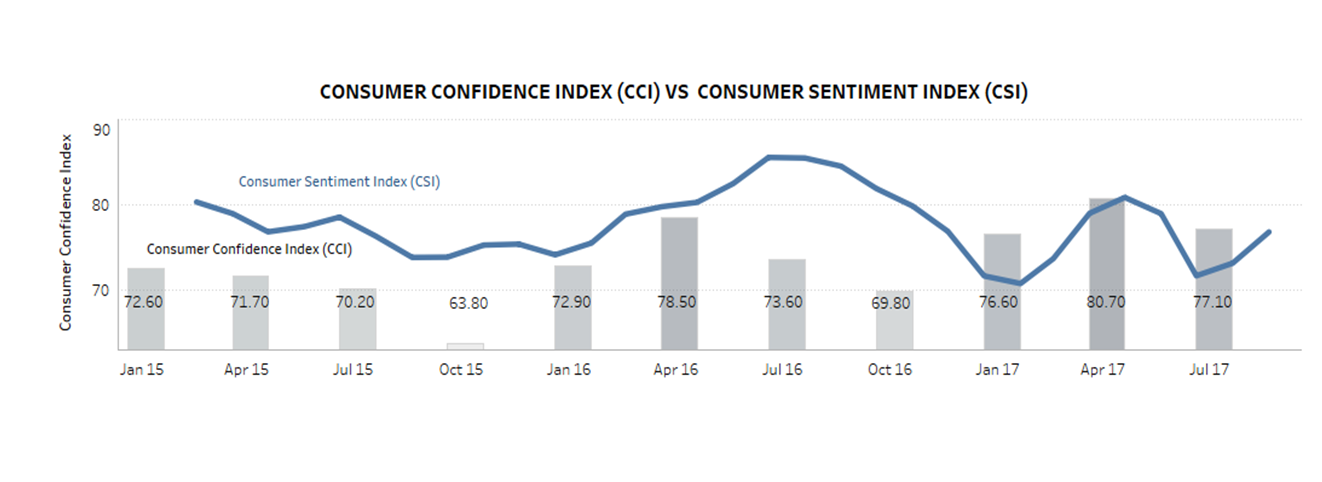
Result of our approach using Consumer Sentiment Index(CSI) vs Consumer Confidence Index (CCI) using large social media datasets. Source: Berkshire Media analysis
Read more about our research work on Consumer Sentiment Index with links to our published papers here.
3. Reduces the forecast error
A GDP forecast error is due to multiple factors and more often than not, it can be compounded by cognitive dissonance and failure to include other sources of data to enhance the forecasting capabilities. An average error rate can hover between 10% to 50% depending on analyst’s forecasting techniques and experience.
A news-based sentiment index provides a leading of growth resulting in reduced forecast errors
The World Bank,
Malaysia Economic Monitor Report 2017
Research by the team at the World Bank showed that the news-based sentiment index (using social media as a source) provides a leading indicator for growth resulting in a reduction of forecast errors in selected countries.
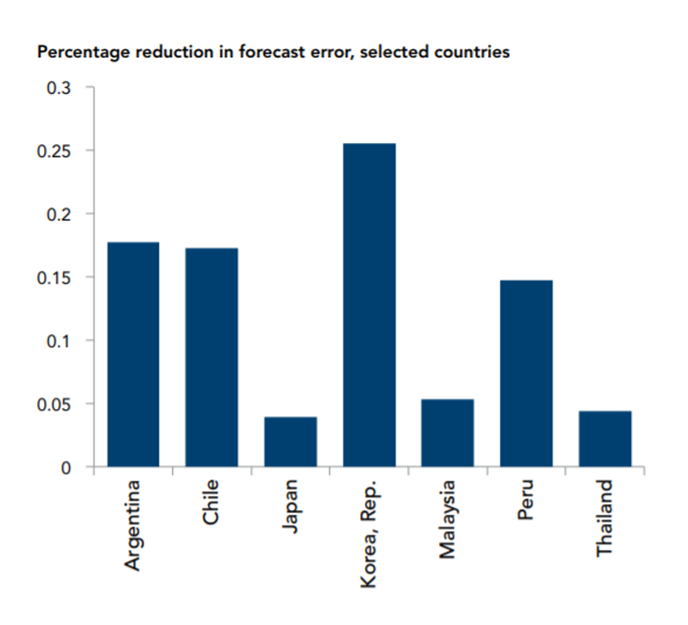
Source: World Bank big data program staff calculations.
The study was performed on several countries such as Argentina, Chille, Japan, Korea, Malaysia, Peru and Thailand to measure the percentage reduction in GDP forecast error.
4. Predict unemployment early
Most economists use the labor force participation rate to determine the unemployment rate – a macroeconomic indicator that we cannot ignore. It also defines the next course of action by policy-makers and central banks.
Investor sentiment and consumer confidence have strong inverse relationships. When the unemployment rate rises, investors guard their money more closely, and consumers become reticent, fearing economic calamity.
Lets look at the current approach to measure the unemployment rate in the United States – using two different labor force surveys.
- The Current Population Survey (CPS): also known as the “household survey” the CPS is conducted based on a sample of 60,000 households.
- The Current Employment Statistics Survey (CES): also known as the “payroll survey” is conducted based on a sample of 160,000 businesses and government agencies
The unemployment rate is updated on a monthly basis by the US Government.
In Malaysia, data on jobs and employment is held by the Ministry of Human Resource. Alternatively, using social data, policy-makers can perform better prediction of the jobs/unemployment.
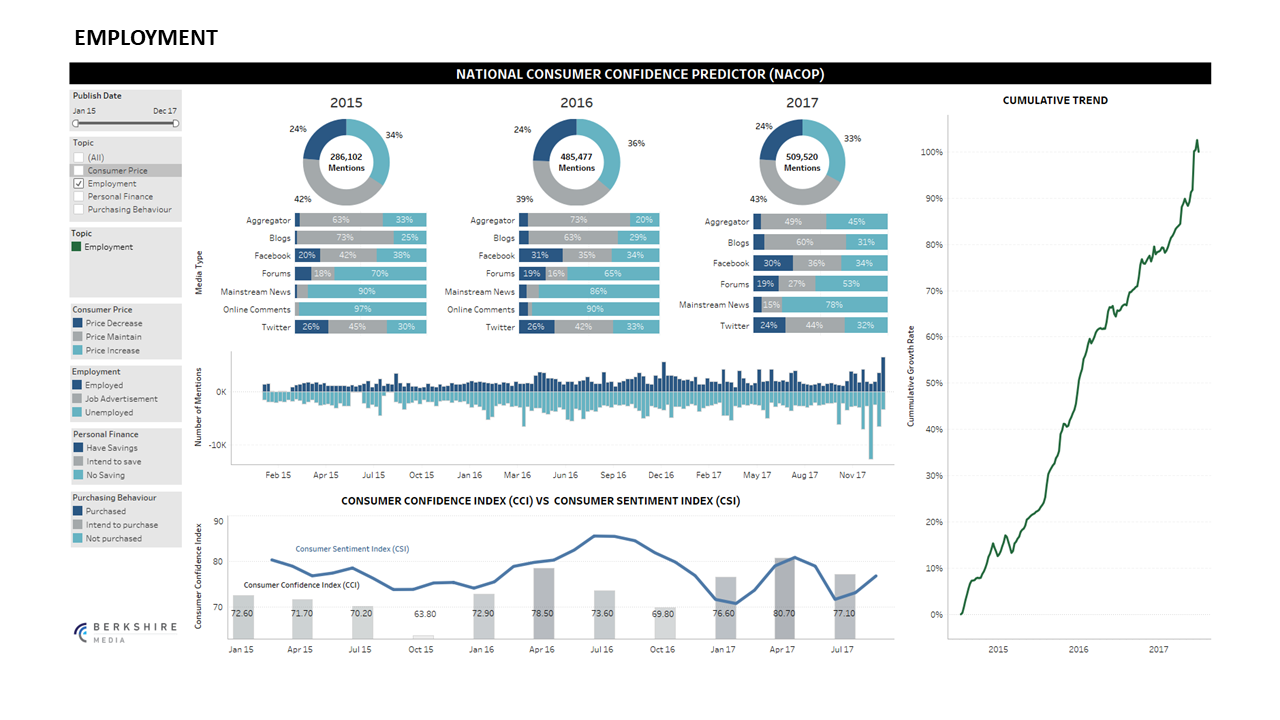
Using a set of 1.1 million social media data from 2015-2017 – coupled with advance data cleaning strategy, our approach has enabled researchers to deep-dive into areas such as:
- Employment – Posts related to new jobs offers, job offers received, salary revision, bonus, increment, new positions, career advancement, expression of gratitude, and others
- Unemployment – Posts related to unemployment such as difficulty in finding jobs, downsizing of headcounts, complaints on securing a job, posts of being jobless, mutual separation and retrenchment, foreign labour replacements and others.
Here is a snapshot of a dashboard showing jobs/unemployment in Malaysia between 2015 – 2017.
Learn more about how we predict consumer behavior and other socio-economic topics here.

About the Author
Shahid Shayaa is the founder and managing director of Berkshire Media. He specializes in data-driven communication strategies and insights using social data analytics, social media monitoring tools and machine learning text algorithms for more than 13 years. As an expert in the field of media monitoring, issue management and reputation risks for companies, his deep involvement in various research studies in this field and published various scientific papers on social data analytics, sentiment analysis and back-end algorithms on consumer sentiment, emotions and behaviour for marketers and campaign managers.
Disclaimer: This information published by Berkshire Media Sdn. Bhd. is for information purposes only and should not be regarded as providing any specific advice. Recipients should make their own independent evaluation of this information and no action should be taken, solely relying on it. Whilst this information is believed to be reliable, Berkshire Media makes no representation or warranty (express or implied) of any kind, as regards the accuracy or completeness of this information, nor does it accept any responsibility or liability for any loss or damage arising in any way from any use made of or reliance placed on, this information.
This report may contain forward looking statements which are often but not always identified by the use of words such as “anticipate”, “believe”, “estimate”, “intend”, “plan”, “expect”, “forecast”, “predict” and “project” and statements that an event or result “may”, “will”, “can”, “should”, “could” or “might” occur or be achieved and other similar expressions. Such forward looking statements are based on assumptions made and information currently available to us and are subject to certain risks and uncertainties that could cause the actual results to differ materially from those expressed in any forward looking statements. Readers are cautioned not to place undue relevance on these forward looking statements. Berkshire Media Sdn. Bhd. expressly disclaims any obligation to update or revise any such forward looking statements to reflect new information, events or circumstances after the date of this publication or to reflect the occurrence of unanticipated events. Unless otherwise stated, any views, data, forecasts, or estimates are solely those of the Berkshire Media Sdn. Bhd. as of this date and are subject to change without notice.


